The Hardness Analysis utilities are based on tests where the imprint created by an indenter is analyzed and quantified.
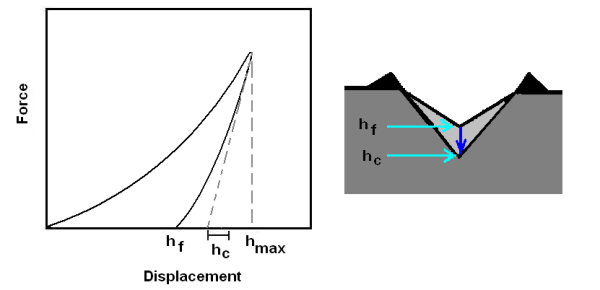
The indentation process and some of the parameters used for hardness analysis can be explained by the load unload curve measured during the indentation test:
Figure courtesy of David Shuman, NanoMc
After the test the imprint will have a final depth denoted hf. The maximum displacement hmax includes the elastic displacement of the surface as well as the indenter. The displacement where the indenter has maximum contact with the surface while unloading is denoted hc. Because of elastic recovery a cross-section of the surface may look like the figure shown to the right with a final depth of hf.
Three primary hardness parameters can be calculated based on the imprint shape; these are:
Where As is the contact area when the displacement equals hc and Ap equals the projected area of the imprint. F is the maximum load force measured in Newton, while P is the maximum load force measured in kg. The contact area and contact height cannot be measured directly because of the elastic recovery but can be calculated based on the projected area Ap. For ideal indenter shapes and flat surfaces the contact area can be calculated in two steps


The constant terms are valid for standard Berkovich and Vickers indenters. The indenter tip rounding can be corrected for by adjusting the area function parameters in the Setup dialog. The area parameters and the calculation of the contact depth hc and the contact area Ac are illustrated in the following figure:
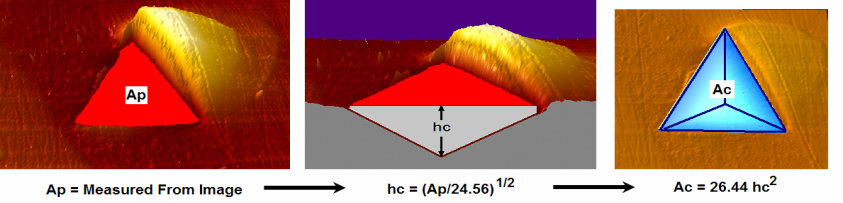
Figure courtesy of David Shuman, NanoMc
To perform a hardness analysis on a loaded image, simply click on the Hardness tool key ![]() located in the Feature Analysis panel of the Analysis ribbon tab group. The Hardness dialog will popup and show the numerical results and the detected projections area will be shown in a new grey scale image:
located in the Feature Analysis panel of the Analysis ribbon tab group. The Hardness dialog will popup and show the numerical results and the detected projections area will be shown in a new grey scale image:


The different fields of the dialog are described below
The Force should be entered as the maximum load force measured in mN
To include the Pile-up region in the calculation check this checkbox; the results will then be recalculated automatically
This field shows the Vickers Hardness result calculated as 
This field shows the Contact Hardness calculated as 
This field shows the Indentation Hardness calculated as 
Clicking this button will open a window showing more detailed information related to the hardness calculation and you may copy paste the result to another document.
When the source image has changed you can perform a recalculation by clicking the Calculate button.
Clicking the Setup button will provide a dialog which will enable you to describe the Projected Area and the Contact Area as functions as function of the contact height hc.

The first term (a0) of the projected area function and contact area function can be fixed to a specific value based on the geometry of the indenter. For a standard Berkovich and Vickers indenters the first terms are:
Projected Area Function:

Surface Area Function:

Because of indenter wear and tip rounding the indenter shape may differ from the ideal. The indenter area functions account for the deviation from the ideal shape [14].
Projected Area:

Surface Area:

Volume:

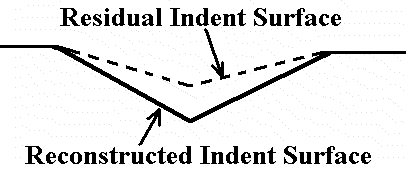
You can enter the ai coefficients if they were measured with another technique. Some nanoindentation software packages allow the calculation of the projected area function from a series of indents over a range of depths by analyzing the load unload curve. SPIP calculates the indenter area functions from the residual indent after elastic reconstruction [15]. The indent projected area and contact area are measured at various heights.
Tangent Height
The tangent height percent is used to control the quality of the outline around the indent [16]. The Tangent Height% is the distance below surface height. The data along the profile is more reliable then that near the surface because of roughness. f the Tangent Height % is too close to the surface then is will make a bad outline that goes outside the indent region. The default setting is at 90% which works for most indent images. However, when the tangent height is too low it does not account for the total projected area.
The calibration dialog is used for calibrating the area function based on the contact depth, ec.
Because of elastic recovery the contact area cannot be measured directly from the residual indent. For most metals such as Aluminum the elastic recovery is in the z-direction [17]. SPIP has a function that reconstructs the fully loaded indentation from the residual indent image. The depths of the each pixel inside the indentation area are decreased by the Elastic Reconstruction Constant.

These fields determine the number of terms to be included in the area functions.
SPIP digitally adds the elastic deformation depth to a residual indent image based on the Elastic constant, ec, and usually ranges between 0.1 - 0.3 for most metals. This value controls how much to increase the depth of each pixel inside the indent area. It follows the linear formula hc = hf (1+ec). The final shape of the indent image should be an identical to the indenter shape.
The parameters hc and ec are bound to by the equation hc = hf (1+ec) and since hf is measured as a fixed value ec is automatically updated when hc is modified and vice-versa.
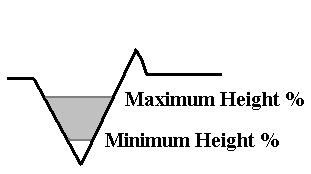
To improve the results you can select the minimum and maximum height of the indent depth to be used for indenter area function calculation. This is used to select the best data and avoid the surface roughness and sharp tip area.