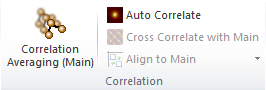
The auto correlation function may be used for enhancing periodic structures and is also used in roughness analysis for extracting correlation length parameters. If the image is periodic the auto correlation function will exhibit peaks with the same periodicity as the source image as shown in the below example. The function is activated from the Ribbon Analyze > Correlation > Auto Correlate.
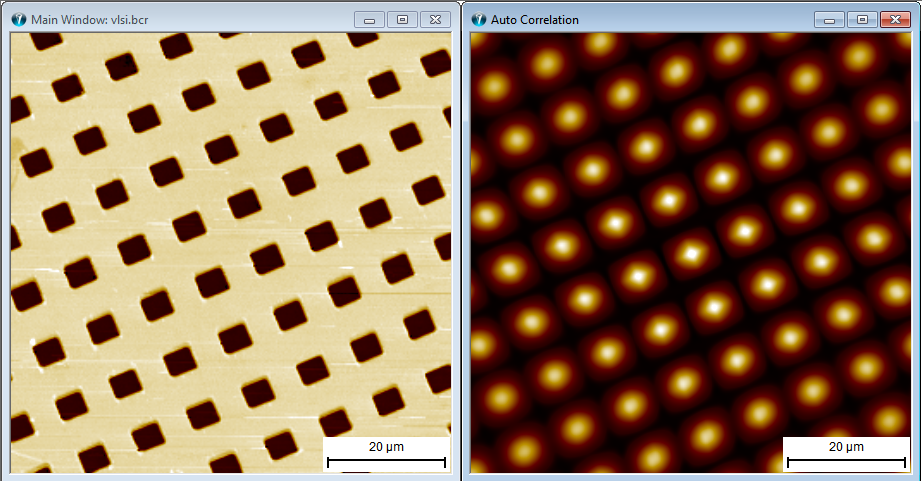
Image together with its Autocorrelation images exhibiting the same periodicity.
The Cross-correlation function between two images can be obtained from an image secondary to the main image window from the Ribbon: Analyze > Correlation > Cross Correlation
The correlation function formulas are shown in the reference guide.
The Align to Main is a tool very useful for comparing very alike image, which could be images of a surface structure before and after some treatment. The images can then be aligned at subpixel level so that they overlap best as possible. By subtracting the aligned images from each other small differences not otherwise visible may be observed.
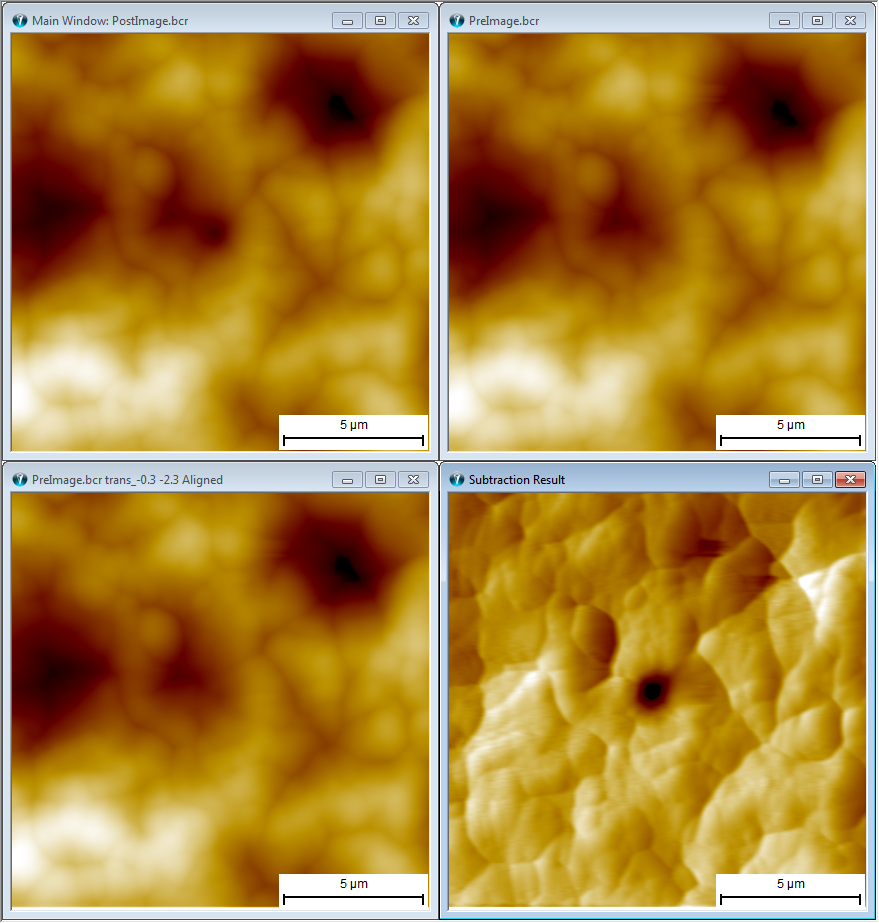
Image comparison example using alignment technique. The upper right image is the Main Image showing a surface after a weak indentation. The upper right image displays the surface before the indentation. To the lower left the "Before" image has been lateral translated by the "Align to Main" function to fit the "After" best as possible. The lower right shows the subtraction result of the Aligned "Before" images from the "After" image and visualizing the effect of the indentation more clearly.
Correlation averaging is a powerful tool for analyzing images and profile data containing repeated structures like atoms, molecules or calibration patterns. The technique can find all the repeated structures and add them so that an average image of the recurrent structure is obtained. In ideal situations the signal-to-noise-ratio can be improved by the square root of the number of additions. In contrast to other filtering techniques it will not filter specific frequencies but preserve all frequencies that are represented in the repeated structure.
The correlation averaging pane gives you control of ´what to average and which optional output windows you want to generate.
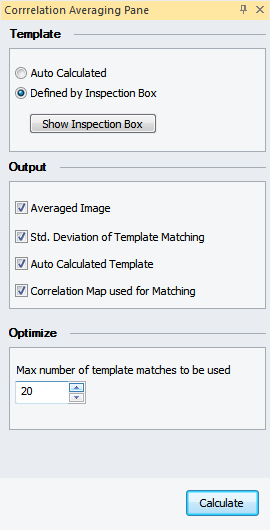
In the Template group you can select the template you want to use. The template is a subpart of the image, which should be found similar at other places in the image. These other places are found at sub-pixel level from a cross correlation image calculated from the template image and the entire image.
The template can be auto calculated by use of unit cell detection . If a unit cell is found the template will be selected large enough to include a unit cell.
You can define the template image by use of the Inspection Box.
The Show Inspection Box is a convenient alternative for activating the Inspection Box instead of the Inspection Box button found in the ribbon.
The Output section allows you to define which output windows you want to have shown.
The average Image is the primary result and you want probably always to have this result shown
As for normal statistical analysis you can calculate the standard deviation image along with the average image. This image may provide information on which part of the template is most alike.
If the template has been auto calculated you may choose to see this template.
The correlation map contains the Cross correlation image between the template and the entire image. Its peaks will indicate the center positions of areas with a good match to the template.
You can define the max number of matches using for averaging, but if SPIP is not able to find that many regions with a good match the actual number might be lower. The actual number use will be shown in the dialog.
The following example is based on an STM image of Didodecyl-benzene molecules self-assembled on a graphite substrate.
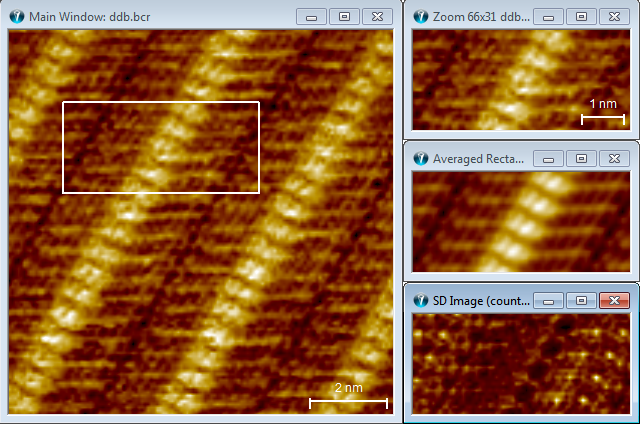
Correlation Averaging example: The left image is the original image shown together with the Inspection Box. The interior of the Inspection box is shown in the top right image. Below is the Correlation Averaging result image and it is observed that this image is much sharper than the template image. The last image is the Standard Deviation image, where the dark colors reflects the image regions that are most similar.