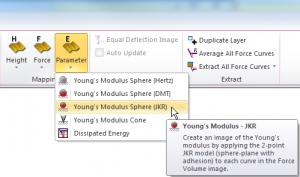
Young’s modulus can be mapped using various indentation models, including Hertz, DMT, Sneddon, and JKR.
Force Curve Analysis
Of particular interest to polymer science, SPIP™ will fit the Hertz, Sneddon, DMT, and JKR indentation models to force curves for quantifying elasticity (Young’s modulus) and for finding the zero indentation touch point.
Not only can SPIP™ process and analyze single force curves and force volume images (maps), but can also process large collections of curves. The results are reported in a spreadsheet with statistics in the bottom.
For suppressing noise in force curves the Filter Module offers powerful features.
Force Volume Analysis (force maps)
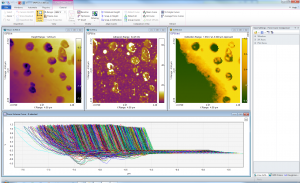
AFM force volume image, height and adhesion image of a thermoplastic matrix with embedded rubber-like inclusions. The curve windows shows all force curves in the dataset.
From force volume images the Force Curve Analysis module can generate various maps, of for example Young’s modulus, adhesion or energy. To get closer to the true equilibrium surface, SPIP™ can map the tip position at the zero indentation “touch” point using the Hertz, Sneddon, or DMT models or by mapping the tip snap-in position.
With an interactive tool the force volume data can be sliced at selected deflection levels generating height images so that it is possible to mimic recording of the topography at different forces (set-points)! Often, force volume data do not contain absolute heights. In such cases a separate height image can be added to the force volume image. Various functions for aligning all force curves in a force map are available.
In order to make it easily to correlate features across multiple images SPIP™ shows the position of extracted force curves in all related images at the same time. The function significantly increases efficiency and visual usability during force curve inspection.

Download SPIP

Request Quote
