SPIP contains more automatic and semi-automatic tools for measuring height differences in images and profiles. Here we described two automated methods for determining the height difference between two planes, the first is based and a height distribution histogram analysis and the second on an ISO 5436 based analysis of individual profiles. Both methods can provide a Z-correction factor when a proper reference value is provided.
The advantage of the histogram based method is that the surface form is of no importance as long as two significant plateaus can be detected while the ISO 5436 methods requires the existence of profiles from which individual grooves or lines can be defined.
The advantage of the ISO 5436 method is that it can measure locally at many positions and thereby produce statistics and standard deviation calculations necessary for evaluating the uncertainty.
The Z-calibration method based on histogram analysis assumes that your image contains two dominating height levels, for example, a waffle pattern or a bearing surface with features rising from the bearing plane etched pitch structures. The best measurement quality is achieved with well-defined upper and lower planes, which will exhibit two main peaks in the height distribution histogram. These are the peaks SPIP will detect and use for the step-height measurement.
![]() The Z-calibration is activated by its associated button in the Ribbon by clicking Image Tools > Analyze > Calibration & FFT the > Z Calibration
The Z-calibration is activated by its associated button in the Ribbon by clicking Image Tools > Analyze > Calibration & FFT the > Z Calibration
![]() Clicking on the Z-Calibration Setup tool key will also perform a step height measurement based on histogram analysis but the Z Calibration Dialog with advanced option will not be invoked.
Clicking on the Z-Calibration Setup tool key will also perform a step height measurement based on histogram analysis but the Z Calibration Dialog with advanced option will not be invoked.
Also, the Z-calibration can be performed from any height distribution histogram window by clicking the Measure button in the Step Height panel. Note that this includes also histograms calculated from single profiles.
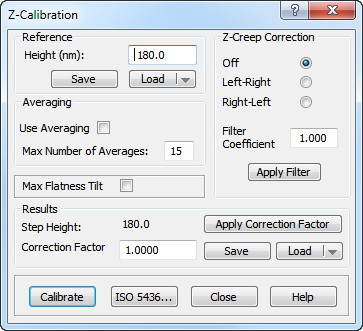
To get the correct correction factor calculated it is necessary to enter the reference step-height for the imaged sample. The correction factor is defined as the reference height divided by the measured height.
You can choose to pre-process the image by applying the Correlation Averaging technique, in which case the average image is entered into the main image window.
The accuracy of the step-height measurement can often be improved by the correlation averaging technique, which will provide an average image with improved signal-to-noise-ratio.
You can limit the number of sub-images to be averaged by defining the Max Number of Averages. Sub-images having the highest similarity with the defined template will be included in the average calculation first. If it is found that the possible number of matches is smaller the defined maximum the applied sub-images will be limited accordingly.
By defining the maximum number of averages, it is possible to avoid distorted sub-areas, which could affect the result.
Step-height images will often exhibit overshoot phenomena at the edges, and these overshoots can be explained by combined creep and hysteresis effects of the Z-piezo element of the scanner. They will affect the height distribution histogram and the quality of the measurement. To limit this effect it is possible apply the Creep Correction function, which adaptively finds the first-order low-pass filter that results in the best histogram, i.e., the one with the highest peaks for the upper and lower planes. Note that the found filter usually only will have little effect on other parts of the image. This is because a filter that changes too much will also destroy the slopes and thereby flatten the histogram, which is exactly not desired. If averaging has been selected this correction will be applied only to the average image.
The filter has the following form and it is the a parameter that is estimated:

Because creep depends strongly on the scanning direction, it is necessary to enter the original scanning direction.
The filter coefficient found will be displayed and it is possible to enter other filter coefficients and apply them to any image.
When setting Max Flatness Tilt On, the image will be tilted (first-order plane corrected) by an iterative procedure so that the histogram peaks are maximized. When the averaging option is set, the max flatness correction is applied to the average image.
The Calibrate button or the Enter key activates the selected calibration procedure.
The results are indicated in the dialog and in the height distribution histogram:
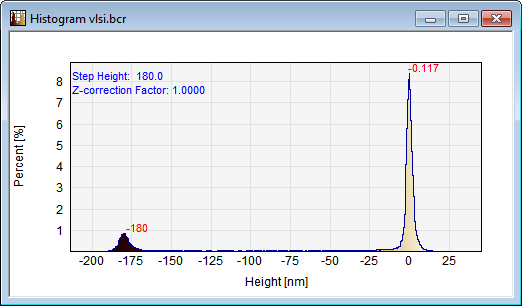
The Z-height values associated with the two histogram peaks are indicated at the peaks. The difference between the peaks reflects the Step-height, which is written at the upper left part of the histogram and the calculated correction factor is written below.
To keep track of the calibration history the result can be written automatically to a file with extension .zpz in the same folder as the data file. This automated function can be set in the Preferences dialog and you can also store it to a file using the Save button in the dialog. The file is a simple text file that can be imported to a spreadsheet program.
The Z-Calibration result can be checked by applying the Z-correction factor and perform a new calibration. You can also enter you own correction factor and apply it to any image.
When clicking on the ISO 5436 button the dialog for ISO 5436 based step height measurement is activated.