Z-Measurement based on ISO 5436 profile analysis requires one or more groove or line profiles. From images these profile may be extracted automatically.
For Images the ISO 5436 step height dialog is activated from the ribbon Analyze > Calibration & FFT > ISO5436 Step Height button or from the Z Calibration dialog . For profiles the calibration can be processed and the dialog opened by clicking on Analyze > Calculate > ISO5436 Step Height button.
When activated from a profile window the profile window will be attached to the ISO 5436 step height dialog and when activated from an image a horizontal profile will automatically be generated and attached to the ISO 5436 Dialog. The profile window provides visual feedback of the parameter settings and the results.
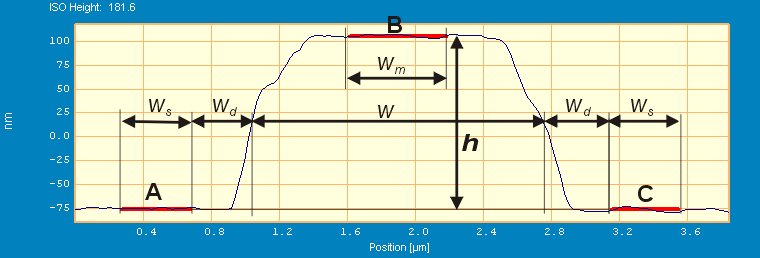
The philosophy behind the ISO 5436 standard is to measure the average heights at plateaus with some distance from the edges and thereby avoid the influence of the edges. For line and groove structures the active measurement areas are indicated below as A, B and C.
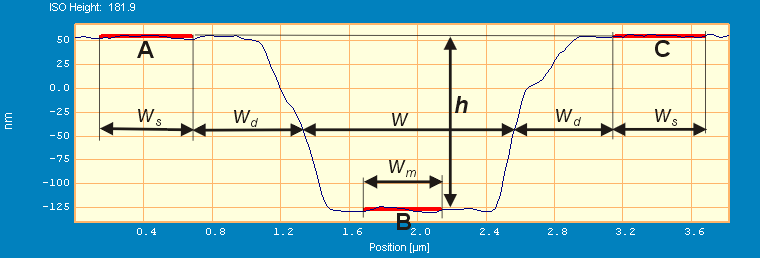
Illustrations of the ISO 5436 principle applied on a line structure and a groove structure
The length of the side areas A and C are denoted Ws while the length of the middle region B is denoted Wm. The distance of side areas A and C from the detected line edge is denoted Wd.
For groove structures the height, h, is defined as the average height of the A and C areas minus the average height of the groove area B. Similarly the height for a line structure is calculated as the average height of the line area B minus the average of the side areas A and C.
The ISO 5436 dialog offers the possibility to define several detection parameters and monitor the results:
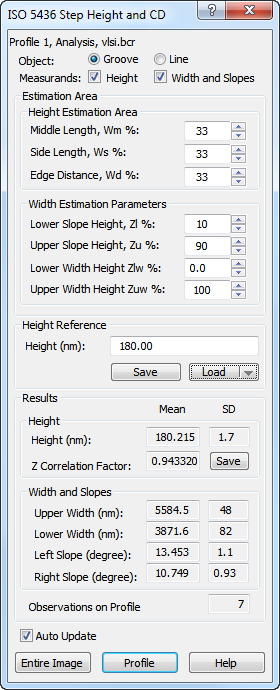
The object radio box defines the object types to be measured, line or groove structures.
The Measurands checkboxes defines what should be measured: Height and/or Width and Slopes. This section describes Height measurements the next section explains Width and Slope measurements.
The estimation areas A, B and C are given by the length values Ws, Wm and Wd, which are defined relatively to the detected line width W, by setting the percentage in the associated fields.
It is possible to adjust these parameters while monitoring the result graphically in the profile window in form of red line markers indicating the A, B and C measurements area and in form of the numerical results shown both in the graph and in the dialog.
When having more structures in the same profile as shown below it is possible to perform more measurements and thereby produce a mean and standard deviation result:
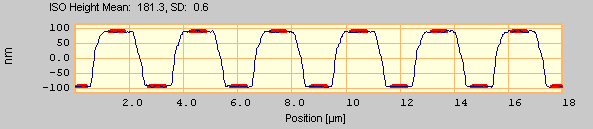
A good strategy for obtaining the most accurate results is to adjust the parameters so the standard deviation is minimized.
The height reference associated with the structure can be entered and so that the Z-Correction Factor can be calculated. When having more calibration standards available it can be convenient to have their reference parameters stored in files, which can be Saved or Recalled by the associated buttons.
The main results of the measurement are the step height and the Z-Correction factor calculated as the reference height divided by the step height. The correction factor can be applied to an image from the histogram based Z-calibration menu described above.
Also, the standard deviation which is calculated when having more than two objects in a profile / image is important as it together with the number of observation can be used for uncertainty calculations. The observation number is for single profiles referred to as "Observation on Profile" and is identical to the number of Grooves or Lines that have been measured. When measuring on an Entire Image the observation number label changes to "Observation Lines, Entire Image", which means that the observation number reflects the number of profiling lines that have been analyzed.
When clicking the Profile button the target objects (line or grooves) are detected and calculated for the current profile attached to the dialog.
When clicking the Entire Image button the target objects (line or grooves) are detected and the mean height calculated for all horizontal cross-sections of the image connected the dialog. The number of observations is reported as the number of profiles for which one or more objects was detected. The reported mean height and standard deviation is based on the mean values from each observation.
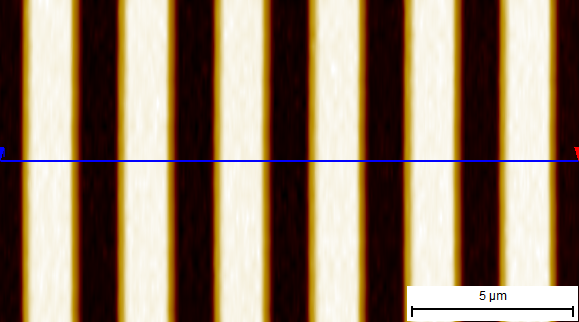
A good result requires that horizontal cross-sections exhibit one or more lines or groves; this is best accomplished when the line structure is parallel to the y-axis as illustrated below:
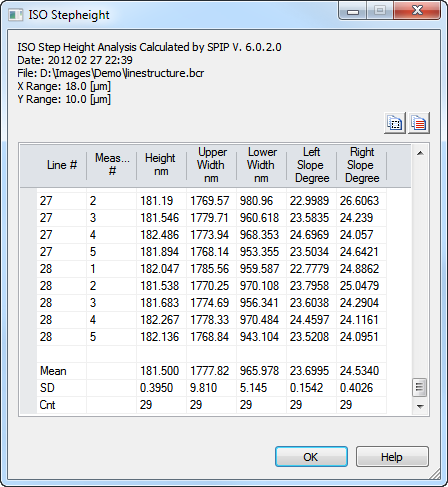
Line structure where all horizontal lines has been analyzed and for each single Groove the Height, Upper Width, Lower Width, Left Slope and the Right slope has been calculated and entered in the grid dialog shown to the right. At the bottom of the grid is the calculated mean and standard deviation shown for all measurands.