MountainsSPIP® Key Features for SPIP Users

Since SPM specialists Image Metrology and Digital Surf joined forces a few years back, development teams from both companies have been working intensively to create the next generation of SPM image analysis software, based on the industry- standard Mountains® platform and including all the best SPIP™ interactivity and analytical tools. Here we highlight some of the key features which our SPIP™ users will benefit from.

Document Interface and Templating

When working with MountainsSPIP® it is like working with a document where you can control the exact layout of multiple pages ready to be exported as impressive printed reports.

You can save your work and pick up where you left off last time

As MountainsSPIP® keeps a track in the workflow of any modification of a processing step, for example change of filter parameters, this change will immediately propagate down to the connected images, charts and numerical results, and the document will be updated accordingly. Therefore, you can easily create a new report with the same layout just by replacing the input image/data. You may even save the report and use it as a template for batch processing and reporting your data files.

MountainsSPIP document interface

Workflow Control and Navigation

Thanks to its unique analysis workflow (see image below), MountainsSPIP™ makes it easy to keep track of analysis steps already applied to data and instantly revert back to any step in the process. Even better, any step can be edited, resulting in all dependent steps being automatically recalculated.

  • Total traceability: See all the analysis steps already applied to your data and instantly revert back to any step in the process. If you edit any step, all dependent steps are automatically updated.
  • Save your work and pick up where you left off last time
  • Exchange a source images by drag dropping and get the document automatically updated according to the process three
MountainsSPIP workflow navigation

Correlative Analysis

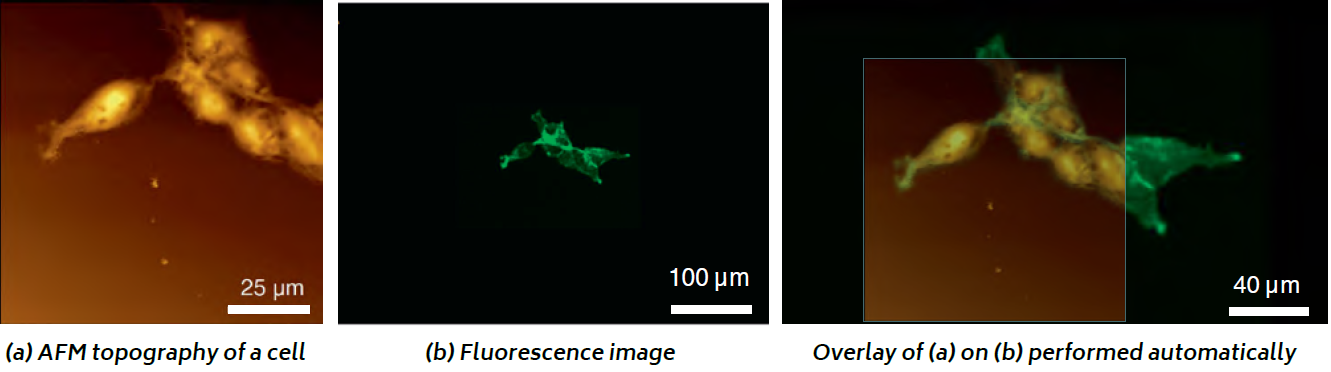
Researchers wishing to explore a sample beyond the limitations of one single instrument technology need look no further than MountainsSPIP 8TM. Whether working with data from 3D optical profilers, AFM, SEM, fluorescence, Raman, IR or other microscopes, users benefit from powerful detection tools which allow them to easily manage data at different scales (see image above).

Density maps, SEM, fluorescence and other images can easily be overlaid on surface topography to facilitate the correlative study of features.
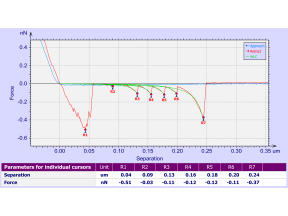
 

Particle Analysis

MountainsSPIP® takes particle analysis to a whole new level. Combining all the best Mountains® and SPIPTM tools, this tool allows users to easily detect and quantify features of any shape and size on virtually any surface.

It is possible to choose which layer of data to use for feature detection then select an appropriate detection method (threshold, watershed, edge or circle detection).

When it comes to quantification, over 70 parameters (area, perimeter, diameter etc.) are available. Analyze the sample as a whole or just click on any individual particle to see parameters instantly displayed!

Check out the video: https://youtu.be/ODU69uqNQHk

Force spectroscopy

Characterizing molecular interactions at the nanoscale using atomic force microscopy (AFM) is a key application in the fields of materials and life sciences.

MountainsSPIP® contains all the features necessary for viewing, processing and analyzing force curves and force volume images.

This includes tools for correcting data, creating interactive parameter maps and managing large collections of curves.

All parameters and results can be exported to Excel at the touch of a button.