Particle Analysis in Images
What is a particle?

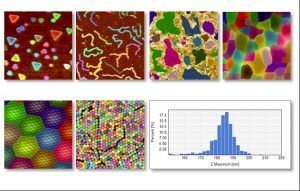
Illustration of various types of shapes that can be detected as particles.
When talking of particles in images, a particle is an area of neighboring pixels that are united by having higher z-values or intensity values than the surrounding pixels or being surrounded by border pixels having a different contrast. For topographic images, such as AFM images, particles will have larger height values than the surroundings. For intensity images such as SEM images the particles may be characterized by having higher intensity than the surrounding pixels.
So, with this definition many types of object can be denoted as particles, for example DNA strings, fibers, biological cells, proteins, molecules, atoms, etc. and the tools for detecting and analyzing such particles will be based on the same generic algorithms.
In the opposite situation where an area of pixels falls out by having lower height or intensity values than the surrounding we call such areas as “pores”. In cases where the particles or pores are closely packed we often denote them as grains. We use the “shapes” as the common name for particles, pores and grains.
The images below show some examples of shapes which can be handled an analyzed as particles.
How to detect Particles in Images
There are basically three methods for finding a particle in an image:
Thresholding. Here all pixels having a value above a defined threshold value will be considered as being part of a particle. This method requires that the background image is rather flat or that the software is able to flatten the background. Professional software will have automated functions for background subtraction and or finding the threshold value.
Watershed. Here the particles are locally defined by finding watersheds. The advantage is that particles can be found even if they are at different height levels.
Shape Based. Here the particles are found by their border pixels, which might be defined by having higher gradient values (change of contrast). In many cases particles can be described well with a best fitting circle and in such cases a circle detection method will often be the preferred tool. The advantage of circle detection is that not all the border pixels need to be defined and the method is even able to detect overlapping particles.
How to characterize particles
When having detected particles by one of the above methods they can be counted and each individual particle can be quantified by a number of parameters such as diameter, area, height. The particles can also be characterized by their form, such as roundness, elongation and orientation. In total, there are more than 60 parameters to characterize a particle.
How to select the particles of interest
In some situation, you might only be interested in particles having for example a diameter above a certain value and in such case, you may filter away the detected particles not meeting this criterion.
How to present particle analysis results
To get confidence in the result it is essential that the found particles can be overlaid e.g. by transparent colors in the source image.

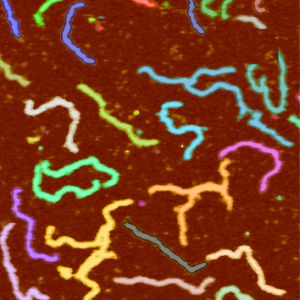
AFM image of DNA strands
The numerical results can be presented in a table with a row for each particle and columns for each calculated particle parameter. The bottom of the table may contain statistical values such as mean and standard deviation for each particle parameter. Histogram charts for all calculated parameter is important for getting an impression of the distribution and scatter diagrams showing the correlation between selected parameters is also valuable.
Various display modes for the detected features including Contour, Filled, Fiber, Skeleton and Semitransparent Mode is available in the SPIP software. Furthermore, the particles can be colored by a specific parameter such as height, area or aspect ratio, or by their class.
The image shows an AFM image of DNA strands adsorbed to a mica substrate. The individual DNA strands have been detected and indicated by different colors their lengths have been measured using Particle Analysis.
Classification of particles
When having different type of particles in an image it might often be interesting to classify them
and perform statistical calculations and counting of each class. Your software may allow you to define the classes based on value ranges for selected particle parameters.

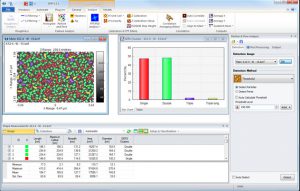
SEM image of Ag coated Si nano pillars used as substrate for surface Raman enhancement. The fraction of touching pillars (the efficient ones) and the free standing pillars are calculated with the classification tools in SPIP.
Batch processing and automation
While software for particle analysis in is self might be a time saver, automation and batch processing can really make you work efficiently with your particle analysis. To handle many images and getting statistical significance it is valuable to have a tool that can batch process the images automatically and generate detailed reports containing images with the detected particle overlaid, tables, charts and summary.
Which software to use for particle analysis?
There are more software packages available for particle analysis both freeware and professional. When selecting the tool that suit your demands you should consider the following characteristics:
- Easy to install and maintain
- Intuitive and easy to use
- Generates reliable results
- Nice and convincing presentation of results
- Professional support
- Productivity advantage
- Support for your image files formats
To learn more about the variety of tools available in the SPIP software package you may visit our description of the Particle and Pore Analysis module
Particle analysis of images is included in the Particle & Pore Analysis Module of the SPIP software package
With the Particle & Pore Analysis Module it becomes easy to detect and quantify particles, pores, grains, and other image features with boundaries. Features of any shape and size can be detected on virtually any surface.
Particle & Pore Analysis is applied for detecting and quantifying features such as particles, pores, grains, surface defects, cells, contamination, pits, pillars etc. This feature is therefore very versatile and finds use in quality assurance, production optimization, general exploratory research and other areas.
Watch the video tutorial and learn how easy it can be to detect and analyze particles.


