
Easy-to-use image analysis
The Welcome Screen provides example images and links to online video tutorials showing how to manage all essential tasks in SPIP™, helping new SPIP™ users to learn how to use the software quick and efficiently.
Productivity enhancement with intelligent ribbons and QuickLaunch
SPIP™ opens and generates many types of data. In order to keep the user interface clear and manageable, the ribbon will configure itself to only show relevant buttons when a given data item is selected. QuickLaunch buttons enhances productivity as functions with advanced options, e.g. Plane Correction, can be executed directly from the ribbon by a single click, thus reducing the need for dealing with advanced dialogues.
Customizable graphical output
All windows in SPIP™ has ”View Settings” giving the user control over a long list of display options ranging from setting the axis font size to switching data pixel interpolation in images on/off or for graphs setting the default number of cursors. This serves both as a powerful tool for interactive visual work and for perfecting views for presentation and publication purposes. All images and curve items can be saved in common graphical formats or copy pasted to for example Word or PowerPoint.
Processing tools
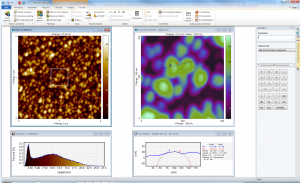
AFM image of water vapor bubbles on a flat substrate.
• Plane Correction
• Area of Interest markers for sub-image analysis
• Subtract profile from image
• Scaling of SEM images
• Mirror and rotation
• Image and curve arithmetic
• Image differentiation and integration
• Change of resolution or image size
• Image cropping
• Void pixels (non-measured points) substitution
Plane Correction (Plane Fit, Flattening) is used for removing image tilt and offset, plane distortion and form, and Z drift and scan line artifacts from SPM images – and for brightness correction in for example SEM images. SPIP™ contains a comprehensive range of manual and automatic tools for Plane Correction all working in conjunction with Area of Interest markers, used for defining estimation areas. Using a cross section profile as assistance it is possible to interpolate single scan lines, ranges of scan lines or just a part of a scan line. It is also possible to subtract a chosen scan line all scan lines.
SEM images often have no information about the length of the x- and y-axes built in. SPIP™ therefore offers a tool for easily setting the correct axis lengths based on the scale bar usually shown in SEM images.
In addition to the essential correction features mentioned above the Basic Module offers various tools for cropping, rotating, mirroring images etc. and for handling “void pixels”, often seen in images from optical profiles (e.g. Interference Microscopes, confocal Microscopes).
Inspection tools
• Zoom & Pan
• Cross-section Profile Analysis
• Synchronized zoom and profiling
• Inspection Box
The unique inspection tools, such as zoom & pan and cross section profiling tools, are SPIP™ trademarks. The number of cross sections in an image is unlimited and can be of any direction and length. Each cross section can average over several parallel lines. Both zoom and cross sections can be applied live to a number of images in parallel, for example the various channels in an SPM recording.
Microscopy Analysis functions and tools
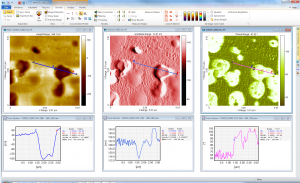
AFM height, amplitude and phase images of an impact co-polymer used for various consumer products ranging from car bumpers to yogurt cups, where lightness, strength and form are important properties. The material is a thermoplastic with inclusions of small elastomer domains.
• Histogram Analysis
• Measure Shapes
• Profile fitting (e.g. radius of curvature)
• Fourier Transform
• Auto Correlation and Cross Correlation
The image histogram shows the distribution of contrast values in an image. The image histogram is interactive in the way that its cursors are linked to the color markers in the image. This means that one can relate image pixels to bins in the histogram and get the corresponding area read out. For height images also the void and material volume is read out.
Measure Shapes comprise interactive tools for measuring angles, distances areas, volumes, diameters etc. The results are displayed in the image, but are also reported in a table, ready for export. The results in the table can all be plotted in various types of charts, just like when performing particle or pore analysis.
For curves, such as cross section profiles, there are various fitting options available, such as radius of curvature fit of selected features in the profile. Both for images and for profiles the Fourier transform (FFT) can be calculated. For advanced FFT analysis the Advanced Fourier Analysis Module is required. Likewise, the Basic Modules offers cross correlation and auto correlation functions, but for more advanced options the Correlation Averaging module is required.
Plug-ins
The SPIP™ platform supports plug-ins for custom analysis or processing of images, for seamless file importing, and for adding custom roughness parameters*). A number of plug-ins is available for download on Image Metrology’s website, where users also can contribute with their own SPIP™ plug-in. SPIP™ Plug-ins are written in C++ or C#
*) Requires the Roughness & Hardness Analysis module.

Download SPIP

Request Quote
