With the Particle & Pore Analysis Module it becomes easy to detect and quantify particles, pores, grains, and other image features with boundaries. Features of any shape and size can be detected on virtually any surface.
Particle & Pore Analysis is applied for detecting and quantifying features such as particles, pores, grains, surface defects, cells, contamination, pits, pillars etc.
This feature is therefore very versatile and finds use in quality assurance, production optimization, general exploratory research and other areas.
Five different detection methods based on thresholding, watershed and circle detection makes it possible to detect objects of almost any type. More than 60 parameters can be calculated for the detected features. Numerical results are shown in an interactive spreadsheet style pane with comprehensive summary and statistics sections, all ready for export to e.g. Excel.
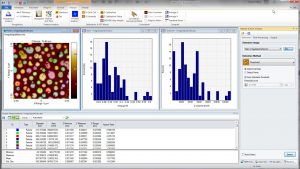
In addition, histograms and scatter plots can easily be generated in order to study the distribution of the particles and pores graphically.

STM image of atomically resolved molybdenum disulfide nanoclusters on a gold Au(111) substrate. The triangular nanoclusters have been detected and the size distribution is shown. (Courtesy of Dept. of Physics, DTU)
Variety of tools
Automatic post processing tools makes it possible to smooth the perimeter of the detected features, fill interior holes, or split touching features. Manual tools for merging, splitting or deleting detected features are available for difficult cases. Unwanted particles or pores can be automatically rejected based on their size or shape.
The module offers various display modes for the detected features including Contour, Filled, Fiber, Skeleton and Semitransparent Mode. Furthermore, the particles can be colored by a specific parameter such as height, area or aspect ratio, or by their class.
Classification of particles & pores
With the Particle & Pore Analysis classification tools, detected particles and pores can be grouped into different classes
based on their characteristics, such as their geometrical shape, height or size. An interactive Classification Editor enables

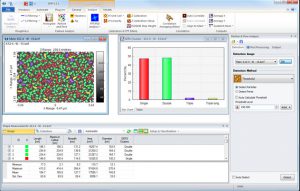
SEM image of Ag coated Si nano pillars used as substrate for surface Raman enhancement. The fraction of touching pillars (the efficient ones) and the free standing pillars are calculated with the classification tools.
new classifications to be generated in less than a minute. Classification results can be studied in both tables and configurable bar charts. It is possible to apply several classifications on the same data set.
Collections – for achieving statistical significance
In order to achieve statistical significance it is often necessary to analyze several images recorded at different positions of the surface under investigation. For this purpose SPIP™ offers the concept of Collections. With Collections SPIP™ combines the result tables for many images in one giant spread sheet and generates statistics, charts and classifications based on all individual particles or pores from all images. The Collection spread sheet has both a flat view mode with a row for each individual feature and grouped mode where each row represents all features from an image. In this way it is easy to find out from which images any outliers may originate from and to exclude outliers or entire images from the analysis.
Analyzing a lot of similar images is easy when combining particle & pore analysis with the Batch Processing & Reporting module.


