Roughness evaluation of images
For evaluating roughness of height images, SPIP™ has more than 30 roughness parameters from various international standards, e.g. ISO 25178-2.
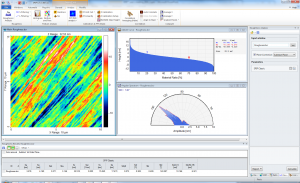
AFM image and roughness analysis of the inner surface of a Polystyrene box.
SPIP™ offers a long list of compelling charts and graphs, including FFT based polar plots that illustrates the angular distribution of the surface texture in various ways, and a bar chart for visual representation of the most commonly used amplitude parameters.
Roughness/waviness filtering is applied in agreement with for example the ISO 25178 standard from the ribbon with just two clicks (requires the Filter Module).
For non-topographic images (e.g. SEM images) SPIP™ offers the same spatial parameters and texture analysis charts as for height images plus a range of statistical parameters describing the distribution of pixel values in the image.
All results and charts are easily copy pasted to Word or Excel - or reported in Word or html (requires the Batch Processing Module).
Roughness evaluation of profiles
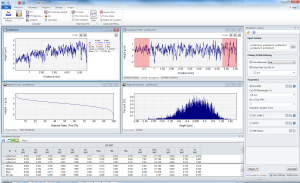
Roughness analysis according to the ISO 4287 standard of surface profiles from a milled steel surface.
The profiles have been recorded with a stylus profiler.
SPIP™ calculates a wide range of roughness parameters and roughness charts on cross section profiles extracted from images as well as on profiles recorded usind profilers. By using the comprehensive tool tips and the information/warning panel it is easy to adhere to major international standards (ISO 4287, ISO 13595-2) for profile roughness evaluation. Besides the stringent standards, SPIP™ also offers a range of the general purpose roughness parameters that is often needed by SPM users as well as a set of parameters for deterministic periodic profiles (e.g. turned or polished surfaces).
Analysis of sets of profiles
Unlike most other software packages SPIP™ can evaluate entire sets of profiles and not only a single profile at a time. A set of profiles may come from multiple profiler recordings or the set may consist of several cross-sections from an image - or all scan lines, if desired. The results for each profile are shown as rows in a table, which also provides statistics across the set of profiles.
Hardness indent evaluation
Using unique algorithms, for example taking care of pile-up, SPIP™ calculates Vickers-, Contact-, and Indentation Hardness, Contact Area, and Projected Area etc. from height images of nano-indentations. The indent outline is shown in the source image. This helps the user judge if the indent has been correctly estimated by the software.

Download SPIP

Request Quote
