Contrast Enhancement of Molecules by Image and Correlation Averaging
More images of the same surface region are aligned and averaged in order to increase the signal to noise ratio. Furthermore, the details of adsorbed hydrocarbon molecules are enhanced by correlation averaging.
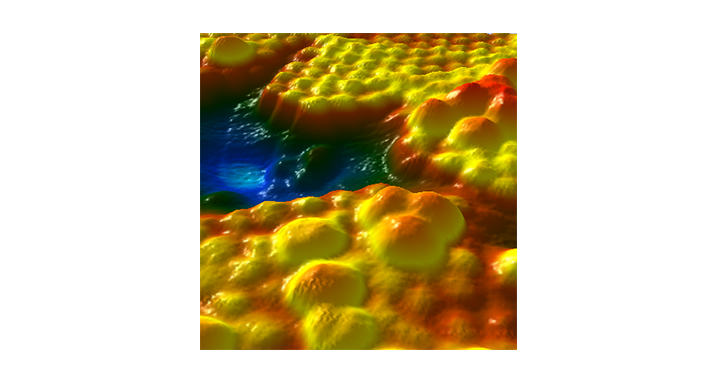
A forward and a reverse STM image of the solution-solid interface between coronene in heptanoic acid solution and HOPG were recorded. The adsorbed layer had been heated to 67°C for 3 minutes in pure heptanoic acid, and then cooled to 17°C for measurement.
Both images have been line wise leveled in SPIP™ before further processing.
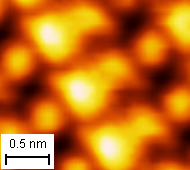
Two domains are observed in the images - One of coronene lying flat in a hexagonal array, and another (lower left) of coronene standing up with heptanoic acid molecules stretched flat between them.
Reference: H.W. Hipps, Washington State University
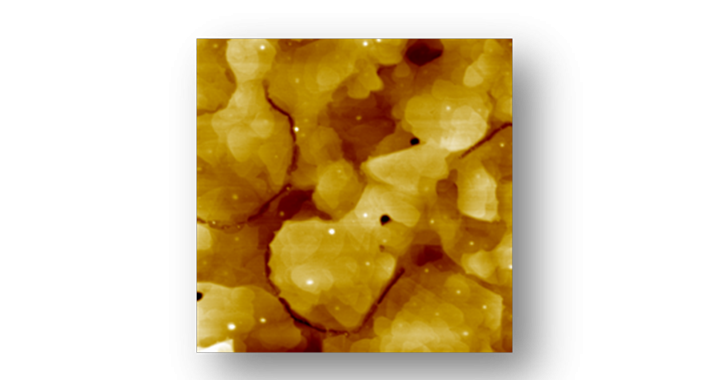
Image alignment
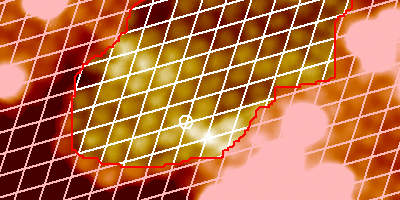
Two scans are aligned and averaged.
The offset is 0.5 pixels in y and 5.8 pixels in x.
The white frame shows the selection used for averaging the array in the upper right part of the image
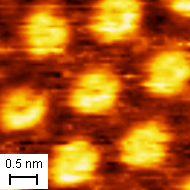
Forward scan

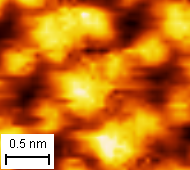
Reverse scan

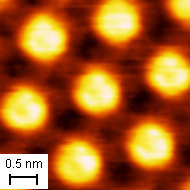
Average

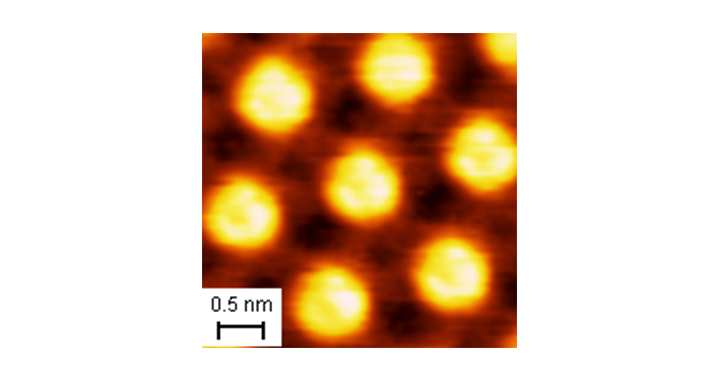
Correlation averaging
By correlating a selected region with the original image an average with enhancement of the details of the molecular array is obtained.
Left:
Templates used for averaging.
Right:
Results
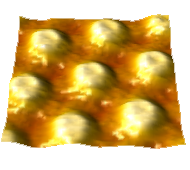
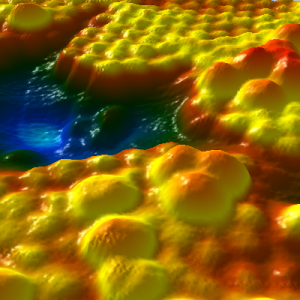
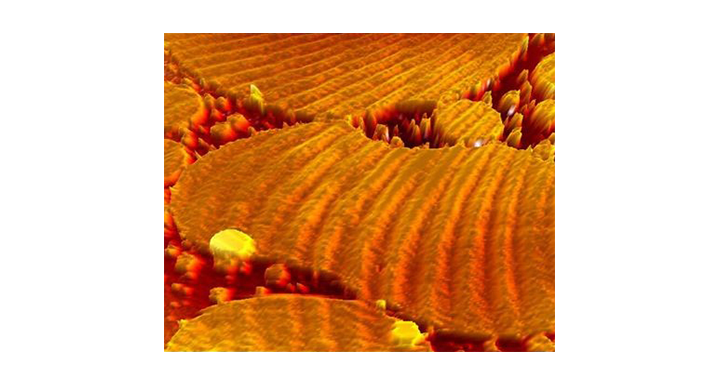
3D view
Often, details are better revealed in 3D. The projections are scaled as x:y:z = 1:1:2.
Left:
Coronene lying flat
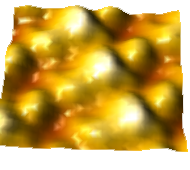
Right:
Coronene standing up