scanning probe microscopy

How to process information from Scanning Probe Microscopy

Scanning Probe Microscopy

Image Metrology's founder, Dr. Jan F. Jørgensen recently gave an interview discussing the field of Scanning Probe Microscopy, which below is re-produced for the knowledge of SPIP™ users.

The SPM Technique

scanning probe microscopy
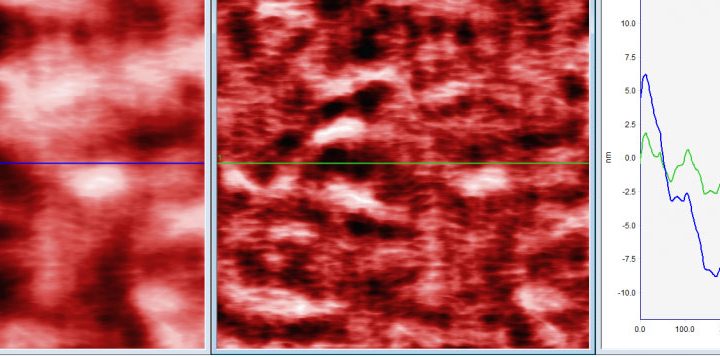
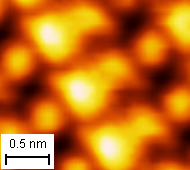
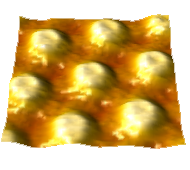
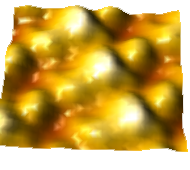
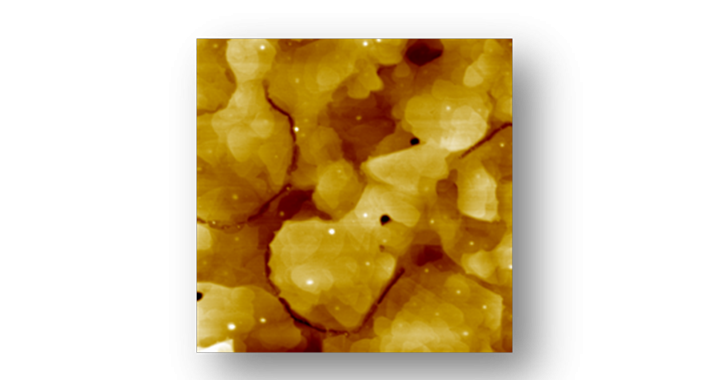
Scanning Probe Microscopy or SPM, is a technique that uses a very sharp probe to scan over a surface in a raster pattern. When the probe is within atomic distance of the surface an AFM (Atomic Force Microscopy) probe can sense the repulsive and attractive forces from the surface. The height of the probe is controlled such that the force is kept constant meaning that also the distance to the surface is kept constant. Therefore, a topographic landscape image can be produced by recording the z position of the probe for the x, y positions.

Effectively the AFM probe traces over the surface of a substrate and records the surface topography as it does so.

Scanning Tunneling Microscopy

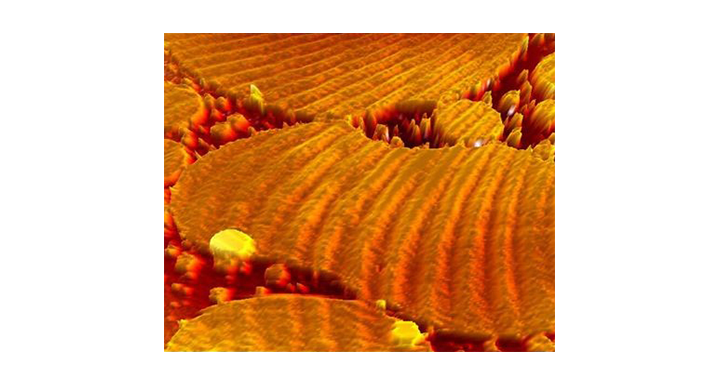
STM (Scanning Tunneling Microscopy) works in a similar manner to AFM but uses a different sensing method. In STM there is a bias voltage set between the probe and the surface and when in atomic distance to the surface a tunneling current can be measured by the probe.

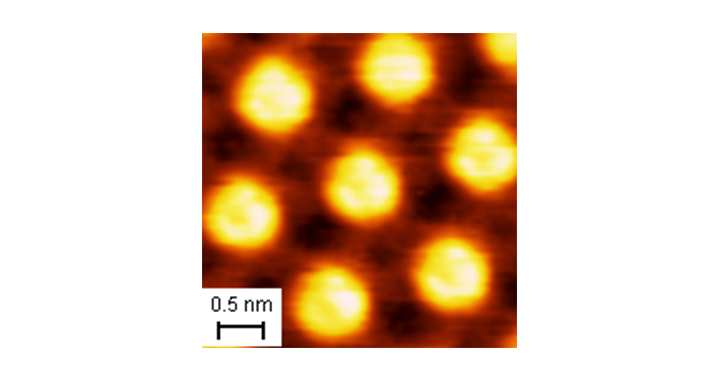
Because both of the techniques involve scanning very close to the surface it is possible to obtain images with atomic resolution.

The SPM Advantages

scanning probe microscopy
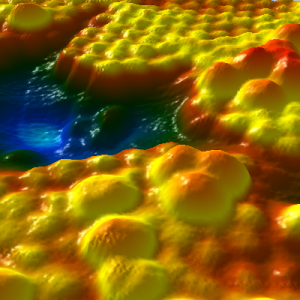
The big advantage of SPM techniques compared to optical techniques is the ability to obtain height information and the unique capability of obtaining images at atomic resolution. SPM allows a lot of geometrical information to be extracted at a very detailed level.

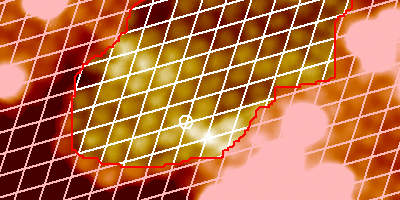
To obtain geometrically correct images it is crucial that the movement of the probe relative to the surface can be controlled better than the desired resolution, which is a big challenge. It is almost impossible to create images where the pixels are acquired equidistantly and where there is no coupling between the axes. Even in the most perfect instrument problems with environmental noise, vibration and temperature changes will lead to imperfect images.

In SPIP™ we have implemented several methods to characterize imperfections and correct for them which allows extremely accurate measurements to be performed.

Contrast Enhancement of Molecules by Image and Correlation Averaging

Contrast Enhancement of Molecules by Image and Correlation Averaging

More images of the same surface region are aligned and averaged in order to increase the signal to noise ratio. Furthermore, the details of adsorbed hydrocarbon molecules are enhanced by correlation averaging.

A forward and a reverse STM image of the solution-solid interface between coronene in heptanoic acid solution and HOPG were recorded. The adsorbed layer had been heated to 67°C for 3 minutes in pure heptanoic acid, and then cooled to 17°C for measurement.

Both images have been line wise leveled in SPIP™ before further processing.

Two domains are observed in the images - One of coronene lying flat in a hexagonal array, and another (lower left) of coronene standing up with heptanoic acid molecules stretched flat between them.

Reference: H.W. Hipps, Washington State University

Image alignment

Two scans are aligned and averaged.
The offset is 0.5 pixels in y and 5.8 pixels in x.

The white frame shows the selection used for averaging the array in the upper right part of the image

Forward scan

Reverse scan

Average

Correlation Averaging SPM

Correlation averaging

By correlating a selected region with the original image an average with enhancement of the details of the molecular array is obtained.

Left:
Templates used for averaging.

Right:
Results

3D view

Often, details are better revealed in 3D. The projections are scaled as x:y:z = 1:1:2.

Left:

Coronene lying flat

Right:

Coronene standing up

PTB – German National Metrology Institute

CASE: PTB - German National Metrology Institute

At the German national metrology institute PTB, SPIP™ is widely used as the main routine tool for the analysis of surface topography measurements on the micro- and nanoscale. While in the beginning, the software package was solely applied for AFM and STM images, it is increasingly appreciated also for the quantitative analysis of images recorded with various other surface measuring techniques and thus increasingly used more broadly in a number of working groups with different focus.

Ludger Koenders, head of department ‘Surface Metrology’: ”At PTB I have been using SPIP™ from the very early days of the software more than 20 years ago, for measuring precisely critical dimensions from AFM images, such as step height and lattice constant of gratings. As SPIP™ users we have significantly influenced the evolution of SPIP™ over the years.” For more than two decades now, the direct contact to the software developers has greatly helped to take the emerging demands of PTB as one of the world’s largest metrology institutes into account, so that new functions and options could be implemented promptly. The software package has thus matured into a generally versatile and particularly reliable tool for image analysis.

PTB_Thorsten_at_AFM_in_cleanroomThorsten Dziomba, scientist in the department ‘Dimensional Nanometrology’: “Right from the beginning of my work in the field of AFM calibration services, I’ve been using the core metrology functions such as step height and grating analysis, and appreciate that Image Metrology has always been taking our concerns seriously, e. g. when it comes to the treatment of data derived from non-perfect, irregular or contaminated samples. Analysis routines have been adjusted in a way that bad data can be identified more easily and consequently excluded, which is important for efficient routine services. SPIP™ is always the main tool to analyze the broad range of nanoscale research measurements we do, whether it is measurements at quantum devices, novel materials, nanoparticles or novel roughness standards, not only with AFM, but also other techniques. There is hardly any software package that has so many import filters to read the measurement data files of many microscope manufacturers. It is a great advantage that we can read the data of different instruments and analyze the images in the very same way. This ensure good comparability.” The latter has become particularly important with the optical surface measuring techniques emerging, e. g. confocal laser scanning microscopy and interference microscopy. As a metrology institute, it is vitally important to carefully investigate the different imaging and measurement properties of the instruments, for example in view of surface roughness.

With the publication of the first ISO standards on areal roughness analysis, Image Metrology has implemented the appropriate routines and also enlarged its tools for profile analysis, thus upgrading SPIP™ also for roughness analysis according to standards.

Thorsten Dziomba continues: “A great advantage of this software package is that it allows a straight-forward use, with a clear focus on what is important for a metrologist, on what is relevant in dimensional surface metrology, without getting lost in a confusing jungle of unnecessary extra functions hardly anybody needs. The direct access to the developers ensures that mathematical problems can be discussed – and solved – in a scientifically profound manner. This is decisive for the use of SPIP™ in critical applications such as official calibrations and international comparisons. Of course, we also keep on maintaining and developing our own software further, partly for comparison, partly because even the best software package could never fulfill all wishes of a metrologist, for that there are too many unique challenges in metrology. Nevertheless, we still have many ideas on how we can develop SPIP™ further together with Image Metrology, and we sincerely hope that we can continue on this successful path!”.

Dupont Research Center

CASE: Dupont Research Center

The DuPont Experimental Station research and development facility in Wilmington, Delaware was established more than 100 years ago, and today, the Experimental Station serves as a key research site for DuPont. Scientists and researchers pursue science-based solutions for global markets including agriculture, nutrition, energy, transportation, electronics, safety and protection, construction, and performance materials.

Greg Blackman is a Research Fellow in Materials Science in DuPont’s Central Research and Development division, and founded the Corporate Analytical Scanning Probe Microscopy and Nanomechanics Lab shortly after he joined DuPont in 1990. Over the years, Blackman has actively influenced the fields of Scanning Probe Microscopy and Nano and Micro tribology of polymers both within and outside of DuPont. In his research, Blackman uses the SPIP imaging analysis software to obtain the best possible results:

“I have been using SPIP since around 2009. We have multi-user licenses and I have trained many of my DuPont colleagues to use the various parts of the SPIP package.

 We use it for its intended use, to analyze data and images from several different scanning probe microscopes, but we also use it to analyze images from optical and electron microscopes and data from optical and stylus profilometry instruments as well.

The package is extremely powerful and I have not found a type of data file that cannot be imported or read by the software. The particle and pore analysis is particularly powerful and we have used it to statistically analyze nano-and microparticle size and shape from atomic force microscope and electron microscope images. We also use the particle and pore analysis to calculate wear volumes and quantify scratch damage and healing on the surface of polymers.

The new profile analysis package is very intuitive and powerful, it allows us to compare profiles from many different tools to understand the size and shape of features at a variety of different length scales. It even enables correlation between surface morphology and optical images to understand the appearance of surfaces and defects.

I no longer use the image or data analysis packages associated with the various instruments, I analyze all my data with SPIP.”

Dow Chemical Company

CASE: Dow Chemical Company

Dow Chemical Company is driving innovations that extract value from the intersection of chemical, physical and biological sciences to help address many of the world's most challenging problems such as the need for clean water, clean energy generation and conservation, and increasing agricultural productivity.

MeyersGregory F. Meyers, Ph.D. is the Group Lead for Corporate R&D at Dow and oversees their global AFM efforts. Dr. Meyers explains why SPIP was the company’s choice in imaging analysis software:

"In 2005 we started a search for third party SPM analysis software.  We wanted something that would be flexible enough to natively handle data from other instruments such as stylus profilers.  The ability to compare data from several different profiling instruments using the same software analysis package eliminates concerns about the vendor's software.   Our clear choice then was SPIP and we signed up 6 users.

Since then we have grown our user base to 14 licenses with full modules on each.  Our user base includes members of our global SPM team and others from allied functions.  We make extensive use of the tip characterization, 3D visualization, force curve analysis, particle and pore, and roughness analysis modules.  We also take advantage of batch processing for higher throughput analysis.  The batch processing is very straightforward allowing one to call up almost all of the functions available in the modules and easily arrange them in sequence for automatic analysis and reporting.  We also find the movie and time series module useful for making movies of dynamic events.  

SPIP has become our go-to 3rd party software analysis choice for SPM (and other) data and image analysis.  Product support is quite good with typically less than 24 hour response for help when needed.  Also Image Metrology listens to suggestions for improvements or new offerings. SPIP is written by SPMers for SPMers - but does much more than that."

Virus Research

Virus Research

Analysis of 2D auto-organized STMV viruses. Reference: Armel Descamps, INSA de LYON / SGM


STMV Viruses

The image exhibits two populations of viruses (STMV) with two discernible diameters.

Detecting repeated structures

Repeated structures can be detected by selecting an Area of Interesting and using the interactive Fourier analysis tools.

Unit cell results

The cell size is calculated automatically when 2 peaks are selected in the Fourier domain.

3D view

3D close-up of the surface exhibiting both viruses of different size.

Molecular Organized System Analysis

Molecular Organized System Analysis

Spectroscopy of surfaces (liquids, solids) in relation with molecular organised systems such as lipids, peptides, proteins, and grafted chains. 3D representation of the brewster and ellipsometric grey levels images obtained with an elli2000 instrument (NFT).

Reference: 

Bernard Despat, Directeur de Recherche, Laboratoire de Physicochimie Moléculaire, Centre National de la Recherche Scientifique


Free SPIP Trial

Request Quote

Download Brochure

Micromilling and Analyzing Terraces

Micromilling and Analyzing Terraces

The University of Padova in Italy conducts research to investigate effects of miniaturization on surface generation in micromilling, with a particular focus on generated surface topographies. SPIP™ is used for plane correction, roughness analysis, and quantification, and 3D rendering of milled surfaces exhibiting terraces.

Ball nose micromilling is an interesting technique for the realization of nearly any type of 3D sculptured surface in the mini and micro scale. In particular, the possibility of applying such technique to machining of hardened tool steel makes micromilling a popular choice for micromolds manufacturing. The action of the cutting tool generates a lay characterized by a typical constant wavelength, corresponding to the machining step over with rough sidewalls and traces of chip residual.

Considering the small values of the cutting parameters involved, understanding and evaluating the relevant tool-workpiece materials interaction phenomena require high resolution 3D measuring instruments, such as atomic force microscopy. Other measuring techniques such as stylus profilometry, optical profilometry and stereoscopic scanning electron microscopy were used for comparison.


Reference: Francesco Marinello, PhD at University of Padova

Raw Image of  Milled Surface

Due to scanning artifacts the terraces are tilted.

Plane Correction

The tilt has been corrected using the Plane Correction tool in SPIP™.

Area of Interest (AOI)

The AOI tool has been used to select a single terrace before measuring the roughness.

Detection of terraces

The terraces have been detected by using the particle analysis module.

3D view

The 3D Visualization Studio allows users to render the surface in 3D. In this 1-1-1 view the color bar has been edited assigning a different color to each terrace.

FORCE Technology

CASE: FORCE Technology

FORCE Technology
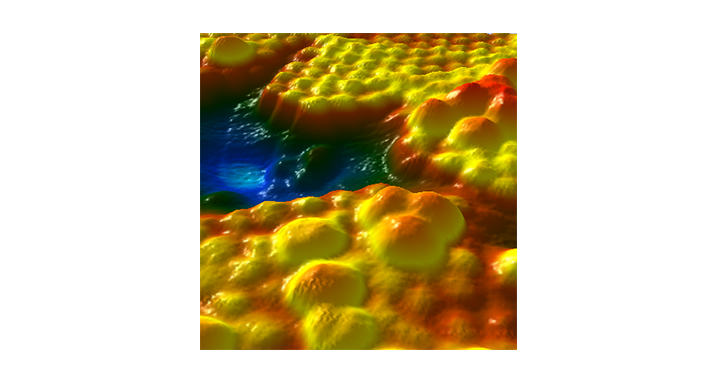
FORCE Technology is a leading independent technological consultancy company based in Denmark. FORCE Technology offers
consultancy and services to a broad range of industries including energy, oil and gas, maritime, manufacturing, medical and infrastructure.

Furthermore, the company offers a wide range of services and solutions for the plastics, composites and rubber industry based on many successful co-operations with key players from the industry.  Examples are co-operations on aspects such as advanced surface characterization and material properties, e.g. in relation to durability and degradation in use, or the application of new plastic, composite and rubber materials and advanced surface coatings and surface structures.

Specialist Thomas Fich Pedersen from the department for Plastics, Composites and Surface Characterization uses SPIP as an integral part of his job:

“I am a very satisfied user of SPIP. I apply it for analysis of 3D images and SEM images, and other optical microscope images. In our department, we use SPIP in a variety of applications, such as measuring porosities in thermally sprayed coatings and characterization of nanometer sized holes in molecular sieve filters. In 3D microscopy, SPIP is our standard software for evaluation of roughness of curved surfaces, and in evaluation of wear and corrosion attacks both on real samples and on replicas of surfaces of for example off-shore pipelines. We have also used the software to evaluate both confocal and AFM images of micro- and nano-structured patterns produced in plastic and metal surfaces".